CSI has been investigating how communities can use ground source heat pumps and other geothermal technologies to provide energy more sustainably.
The University of California, Berkeley, is building a clean electrified heating and cooling plant utilizing shallow geothermal to cut down greenhouse gas emissions. As part of the Clean Energy Campus’s project “The Role of the Underground to Realize a Zero-carbon UC Campus Energy System”, Soga Research Group conducted a geothermal investigation in a 400 feet borehole on campus. This investigation aims to determine the feasibility of geothermal as part of the energy system strategy and meeting UC carbon neutrality as well as advancing understanding of geothermal as a climate and energy solution in a variety of settings.
This study shows that deep borehole drilling on the campus is relatively easy, and the thermal properties of the underground are suitable for the GSHP system. Based on the estimated geothermal properties, the preliminary numerical analysis indicates that 200 400-ft geothermal boreholes can help cover 97.4% of the heating energy and reduce 9917.6 tons of CO2 emissions for the Business and Law node.
In the future, the coupled geothermal-building physics model will be built to provide a better understanding of the geothermal potential and help improve the design and operation of the renewable energy system.
Instrument Plan
The 400-ft monitoring borehole was drilled for measuring the geothermal properties and other research purposes. After the geophysical logging, the geothermal heat looping pipe (U-pipe) with instruments attached was installed and grouted inside the borehole. Sensors installed inside the borehole include Distributed Temperature Sensor (DTS), Strain Fiber Optic Sensor, FBG Piezometer, Vibrating Wire Piezometer, and Short-Period Geophone. Figure 1 provides a brief configuration of the borehole, and Figure 2 shows in-situ installation of sensors.
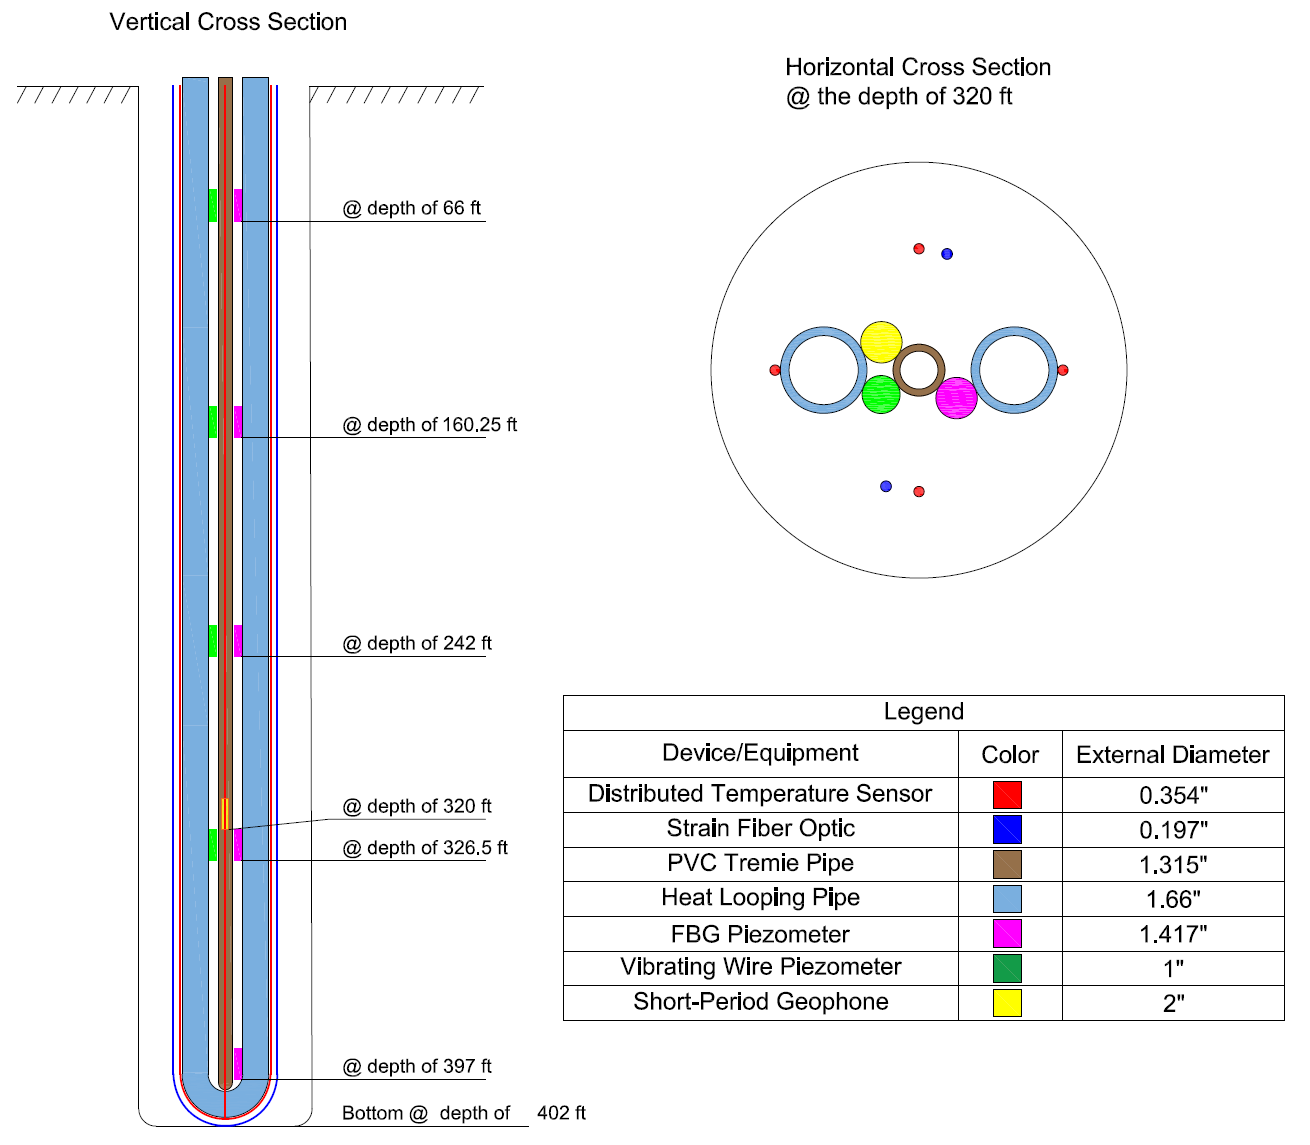
Figure 1 Configuration of the deep borehole

Figure 2 Installation of the heating pipe and instruments
Temperature Monitoring
The ground temperature was measured from April 22 to June 2, and the geothermal gradient is calculated as 0.0136 ℉/ft (24.79 ℃/km), which is similar to the normal range of the geothermal gradient (0.0137 – 0.0165 ℉/ft or 25 – 30 ℃/km).
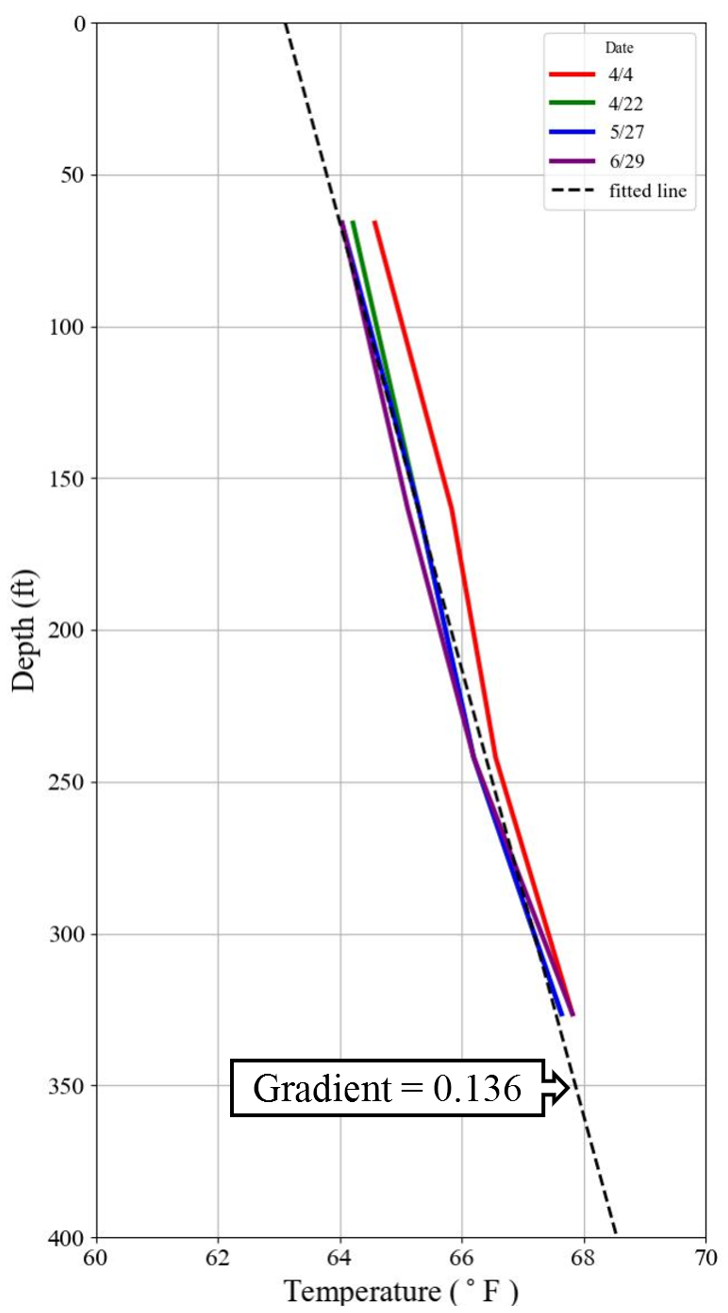
Figure 3 The Ground Temperature Profiles
The temperature variation along the borehole during grouting was measured using distributed fiber optic temperature sensor (DFOS) and is shown in Figure 4. Distributed fiber optic temperature sensors work well on recording the temperature variation during the construction process and revealing valuable patterns. For example, a large temperature drop can be found in all curves of ΔT versus time at roughly 8 pm, and this is caused by restart of grouting, which was interrupted at 2 pm.
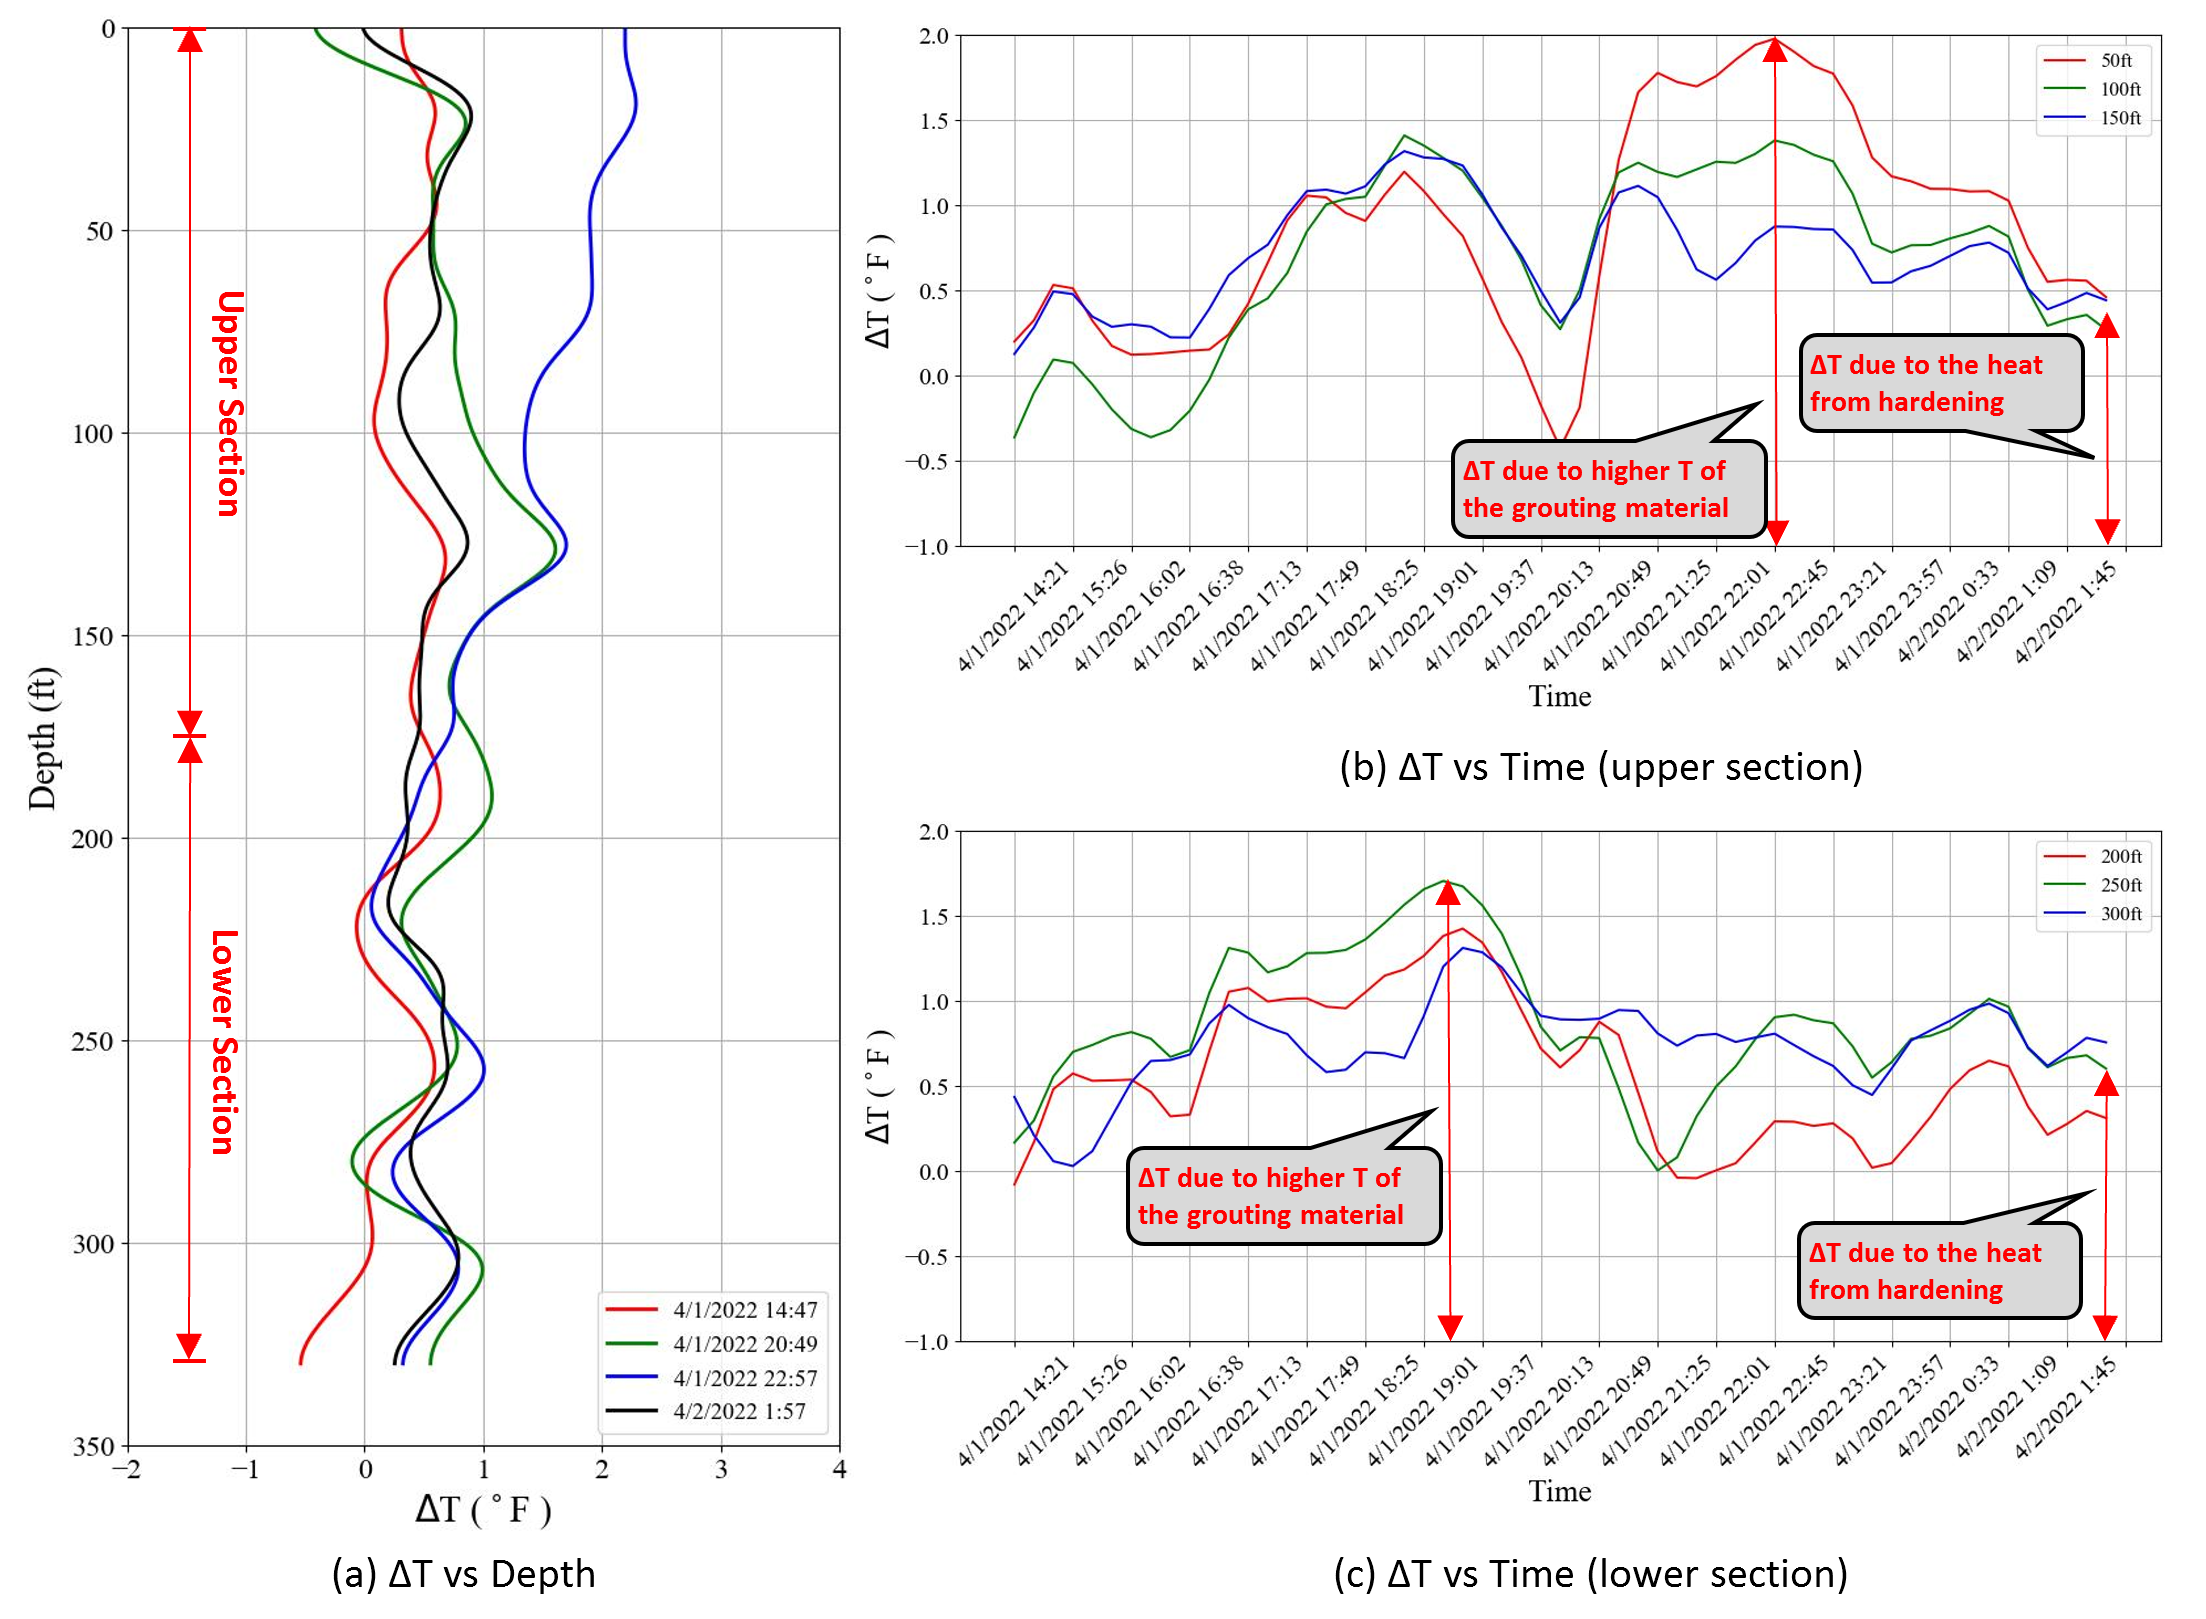
Figure 4 Change of temperature During the Grouting Process
Distributed Thermal Response Test
The thermal response test (TRT) is a conventional testing method measuring the geothermal properties of the ground. It is conducted in a geothermal heat exchanger where a U-pipe is installed inside a borehole. In the test, water is heated by a constant input heat and circulated in the U-pipe, and temperature change is recorded to estimate geothermal properties. However, limited by analytical method and temperature monitoring techniques, conventional TRT can only evaluate the average geothermal properties without considering the variation along the depth.
Distributed fiber optic sensor (DFOS) was adopted in TRT, and two distributed thermal response tests (DTRTs) were performed on the 400 feet borehole. DFOS was installed both inside and outside the borehole as shown in Figure 1. Two DFOS analyzers, Brillouin Optical Time Domain Analyzer (OMNISENS) and Brillouin Optical Time Domain Reflectometer (ALICIA), were used in two DTRTs, respectively.
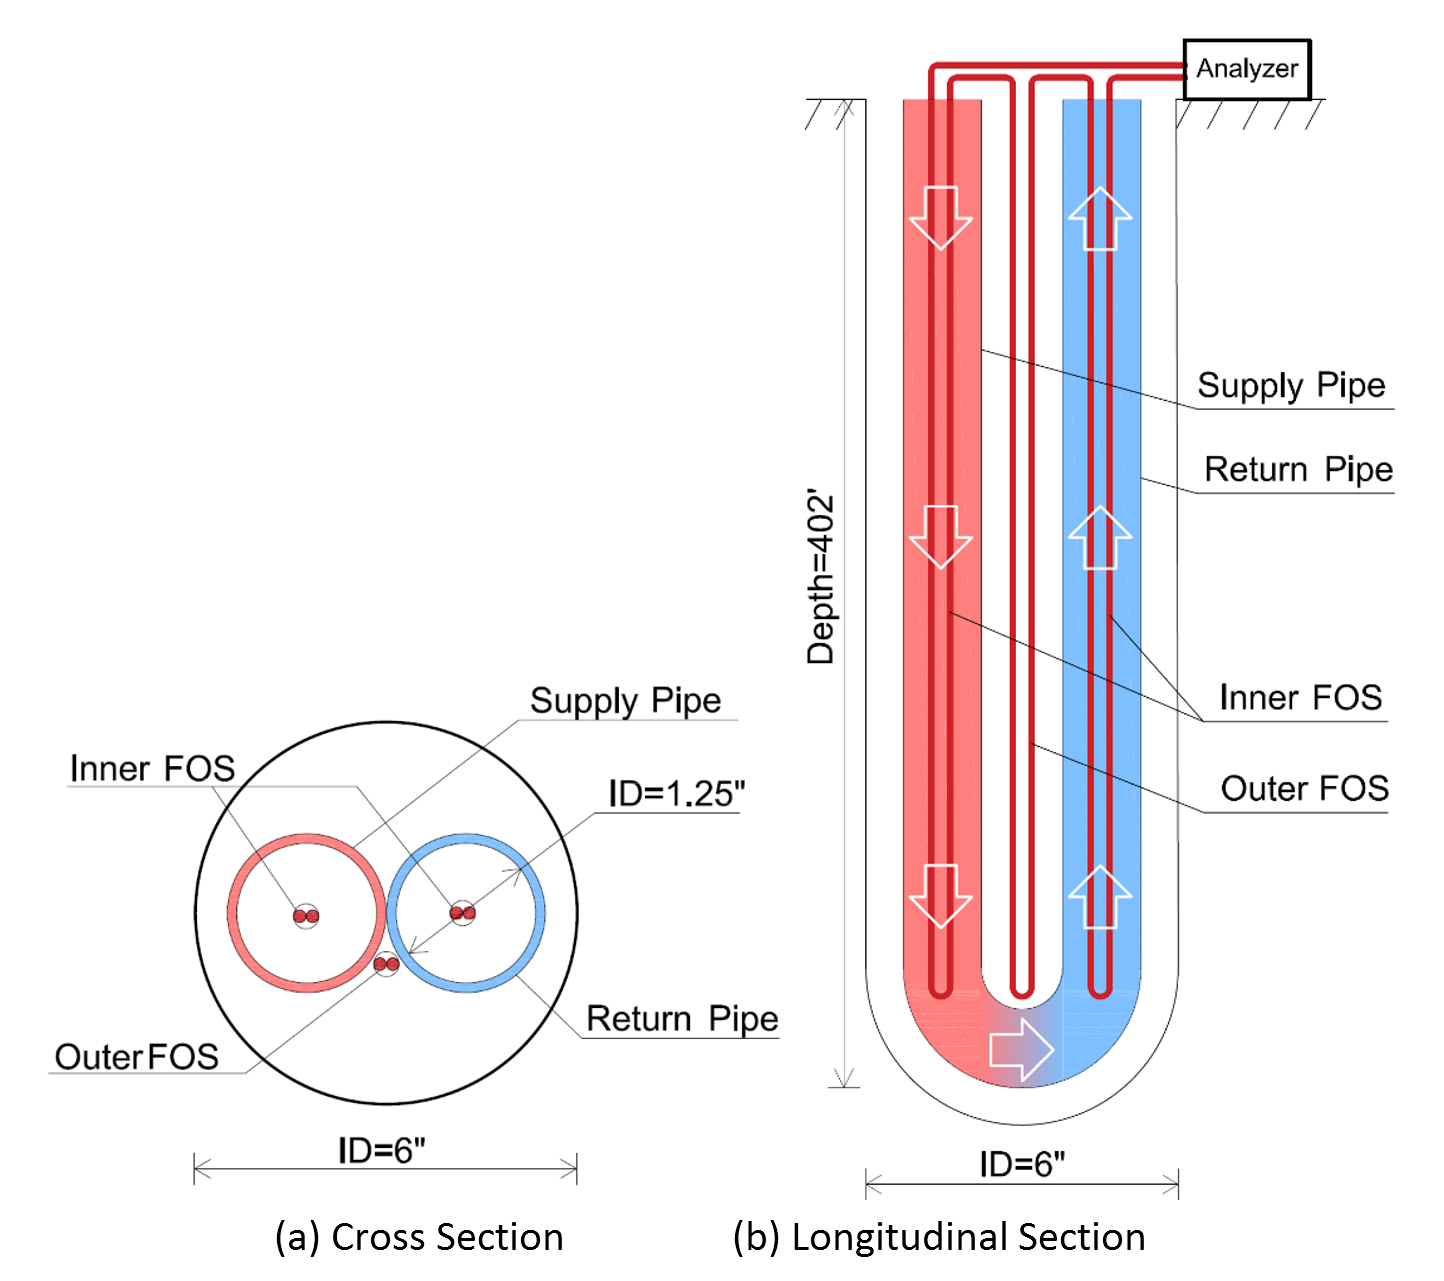
Figure 1 Borehole Configuration
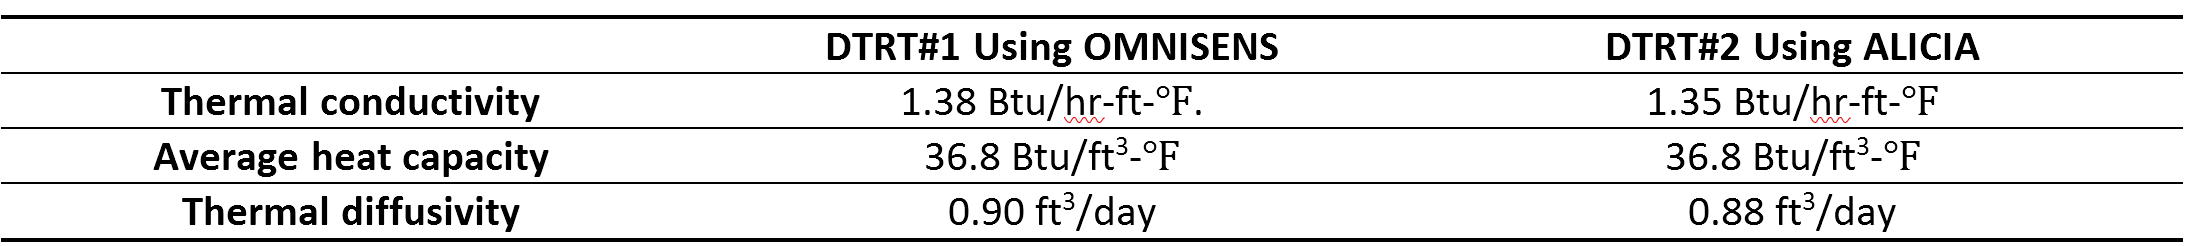
The first DTRT was performed between Sep. 2 and 4, 2022, with a heating phase of 46.6 hours followed by a temperature decay phase of 12 hours. The second DTRT was performed between Sep. 31 and Oct. 4, 2022, with a heating phase of 47 hours followed by a temperature decay phase of 24 hours. Average geothermal properties calculated by conventional line source method are shown in Table 1.
Table 1 Summary Thermal Properties of Two DTRTs
Temperature change recorded by DFOS in two DTRTs are shown in Figure 1.1 – 1.9 and Figure 2.1 – 2.9, respectively. Main conclusions are summarized as follows:
- DFOS performed well in recording the spatiotemporal variability of temperature change during DTRTs. Temperature measured by DFOS near the ground surface match well with temperature recorded by the thermometer in the TRT Rig.
- In the heating phase, the temperature change is linear to the natural log time, but the slope of the curve is changing along depth due to variation of geothermal properties. In the temperature decay phase, curves of temperature change versus elapsed time are not linear and become gentler with time. It is due to the dissipation of residual heat from the borehole to the ground, which will be further studied through more advanced numerical analysis.
- The profiles of temperature change versus depth generally show a “V” shape, and the temperatures in the supply and return pipes converge at the depth of 250 ft. This means the heat transfer efficiency is very low below 250 ft, which is probably due to the poor grouting quality.
- DFOS installed inside the U-pipe has better performance than DFOS outside the U-Pipe. As expected, DFOS outside the pipe recorded a lower temperature. Due to the uncertainty in its positions, the DFOS data from the outside of the U-pipe suffer data fluctuation. It was not possible to measure the temperature difference between the supply and return pipes.
Click HERE for detailed data…
Estimate of Geothermal Property Profile
The subsurface was divided into three main layers, and the analytical method developed by McDaniel et al. (2018) was applied as a fast method to estimate the thermal conductivity profile. This method assumes the radial temperature gradients from the U-tube to the subsurface are constant and uniform at the steady state.
Results of two DTRTs are shown in Figure 1 and 2. In the first test, λ for the sediment above 30 ft is 6.2 Btu/hr-ft-℉, and λ for the bedrock from 30 ft to 250 ft is 1.4 Btu/hr-ft-℉; in the second test, λ for the sediment above 30 ft is 1.2 Btu/hr-ft-℉, and λ for the bedrock from 30 ft to 250 ft is 1.4 Btu/hr-ft-℉. Compared with conventional TRT, DTRT estimates higher thermal conductivities for bedrock above 250 ft because it considers the low heat transfer efficiency below the depth of 250 ft.
The thermal conductivity of the bedrock (30 – 250 ft) estimated from two DTRTs match well with each other. However, two tests estimate different thermal conductivity for the sediment above the depth of 30 ft, and in the first test, λ for the sediment above 30 ft is too high. This is due to the spatial fluctuation of the temperature data along the depth, and the thermal conductivity estimated from the temperature gradient can be easily affected by the fluctuation.
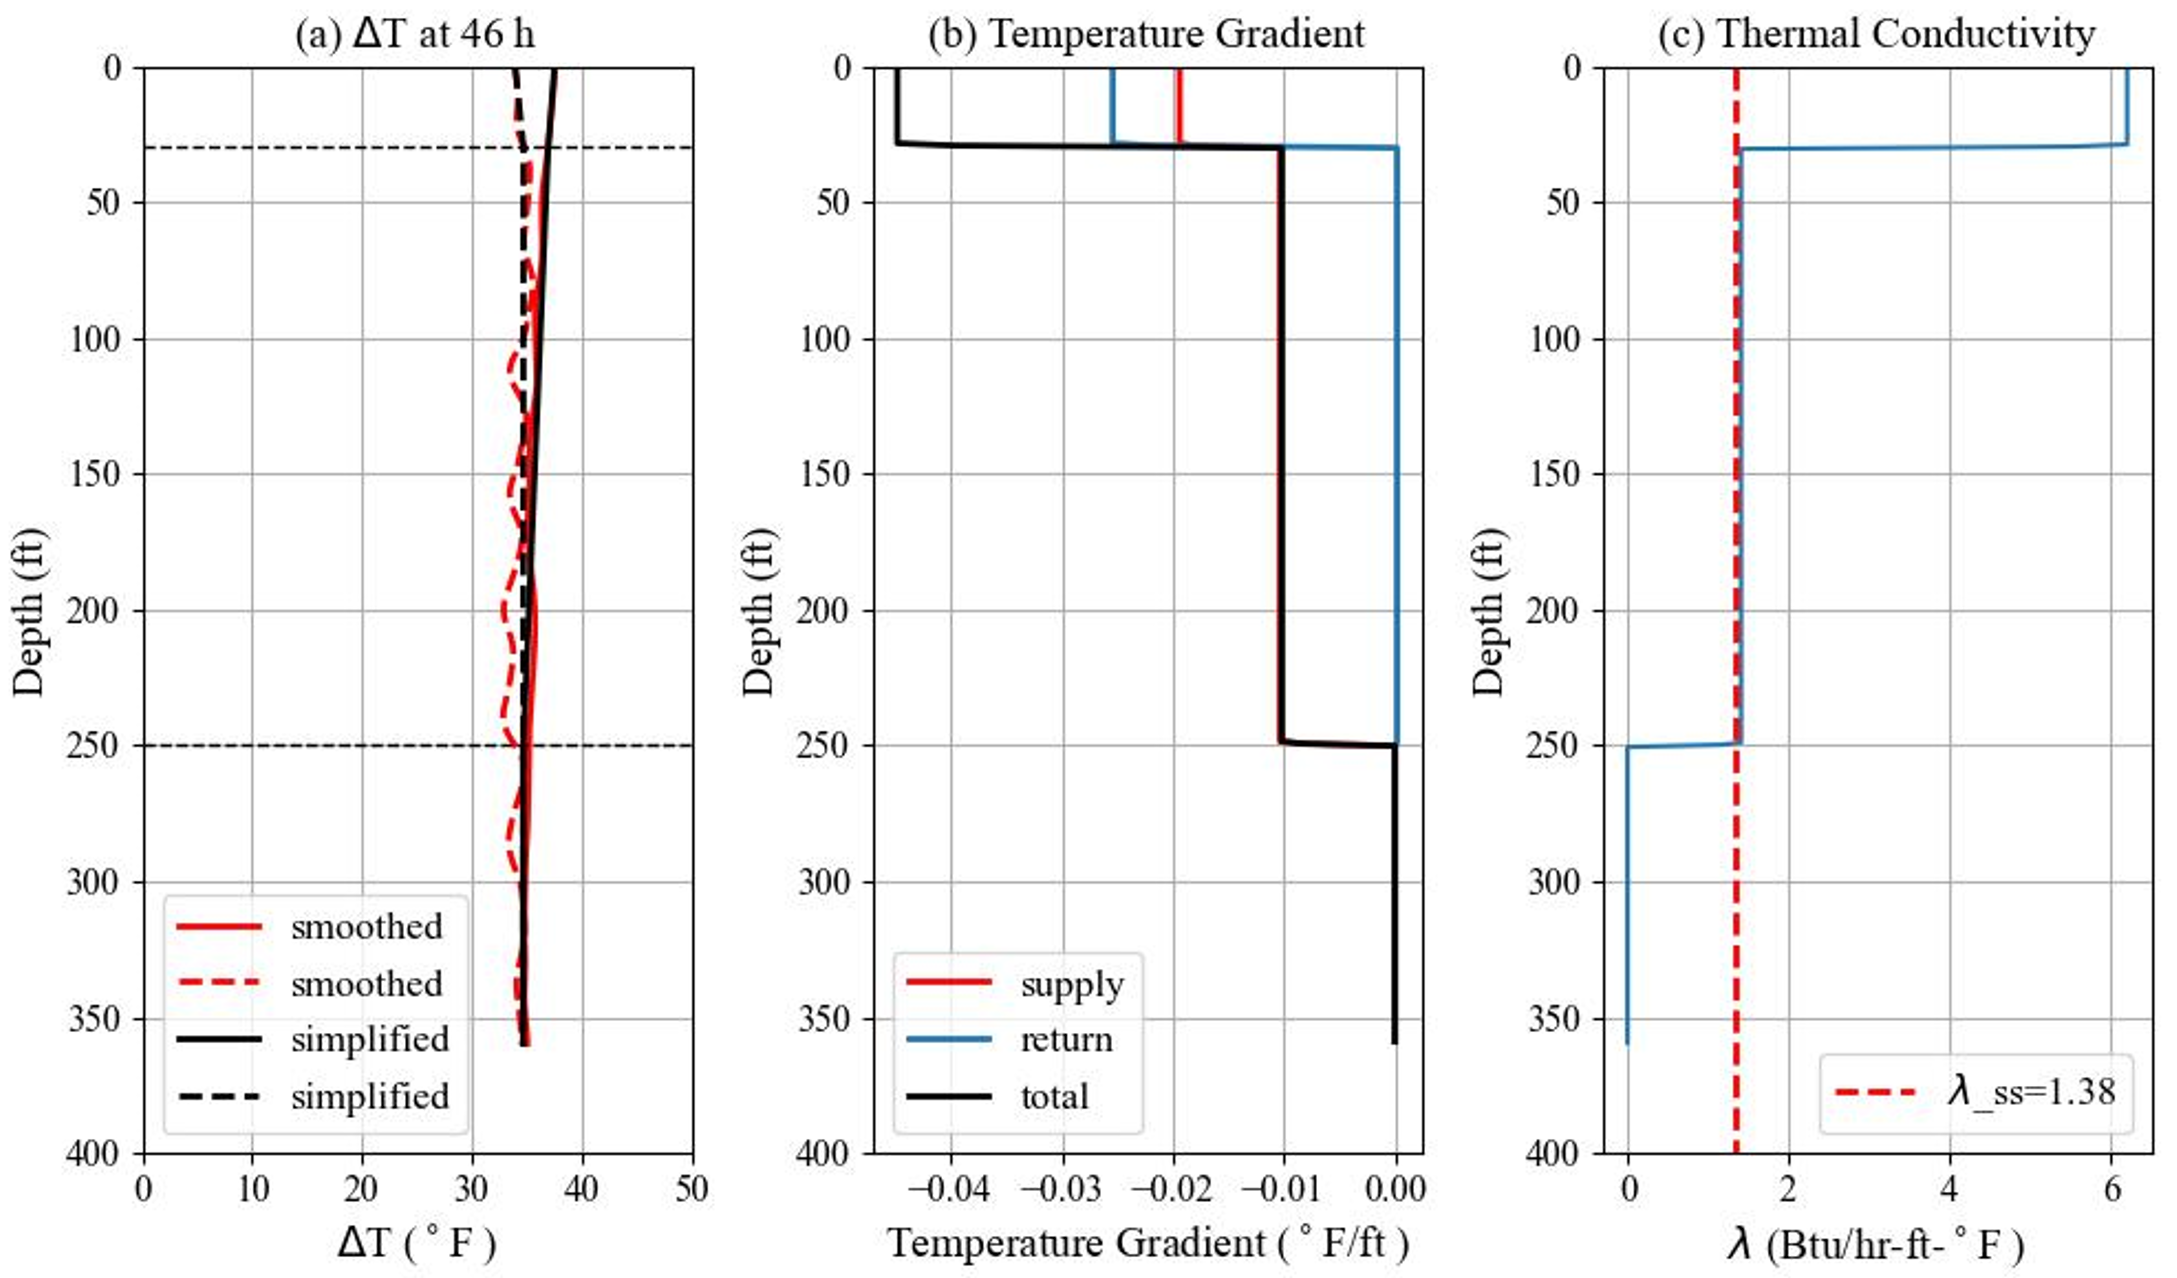
Figure 1 Thermal Conductivity of The First DTRT Using OMNISENS
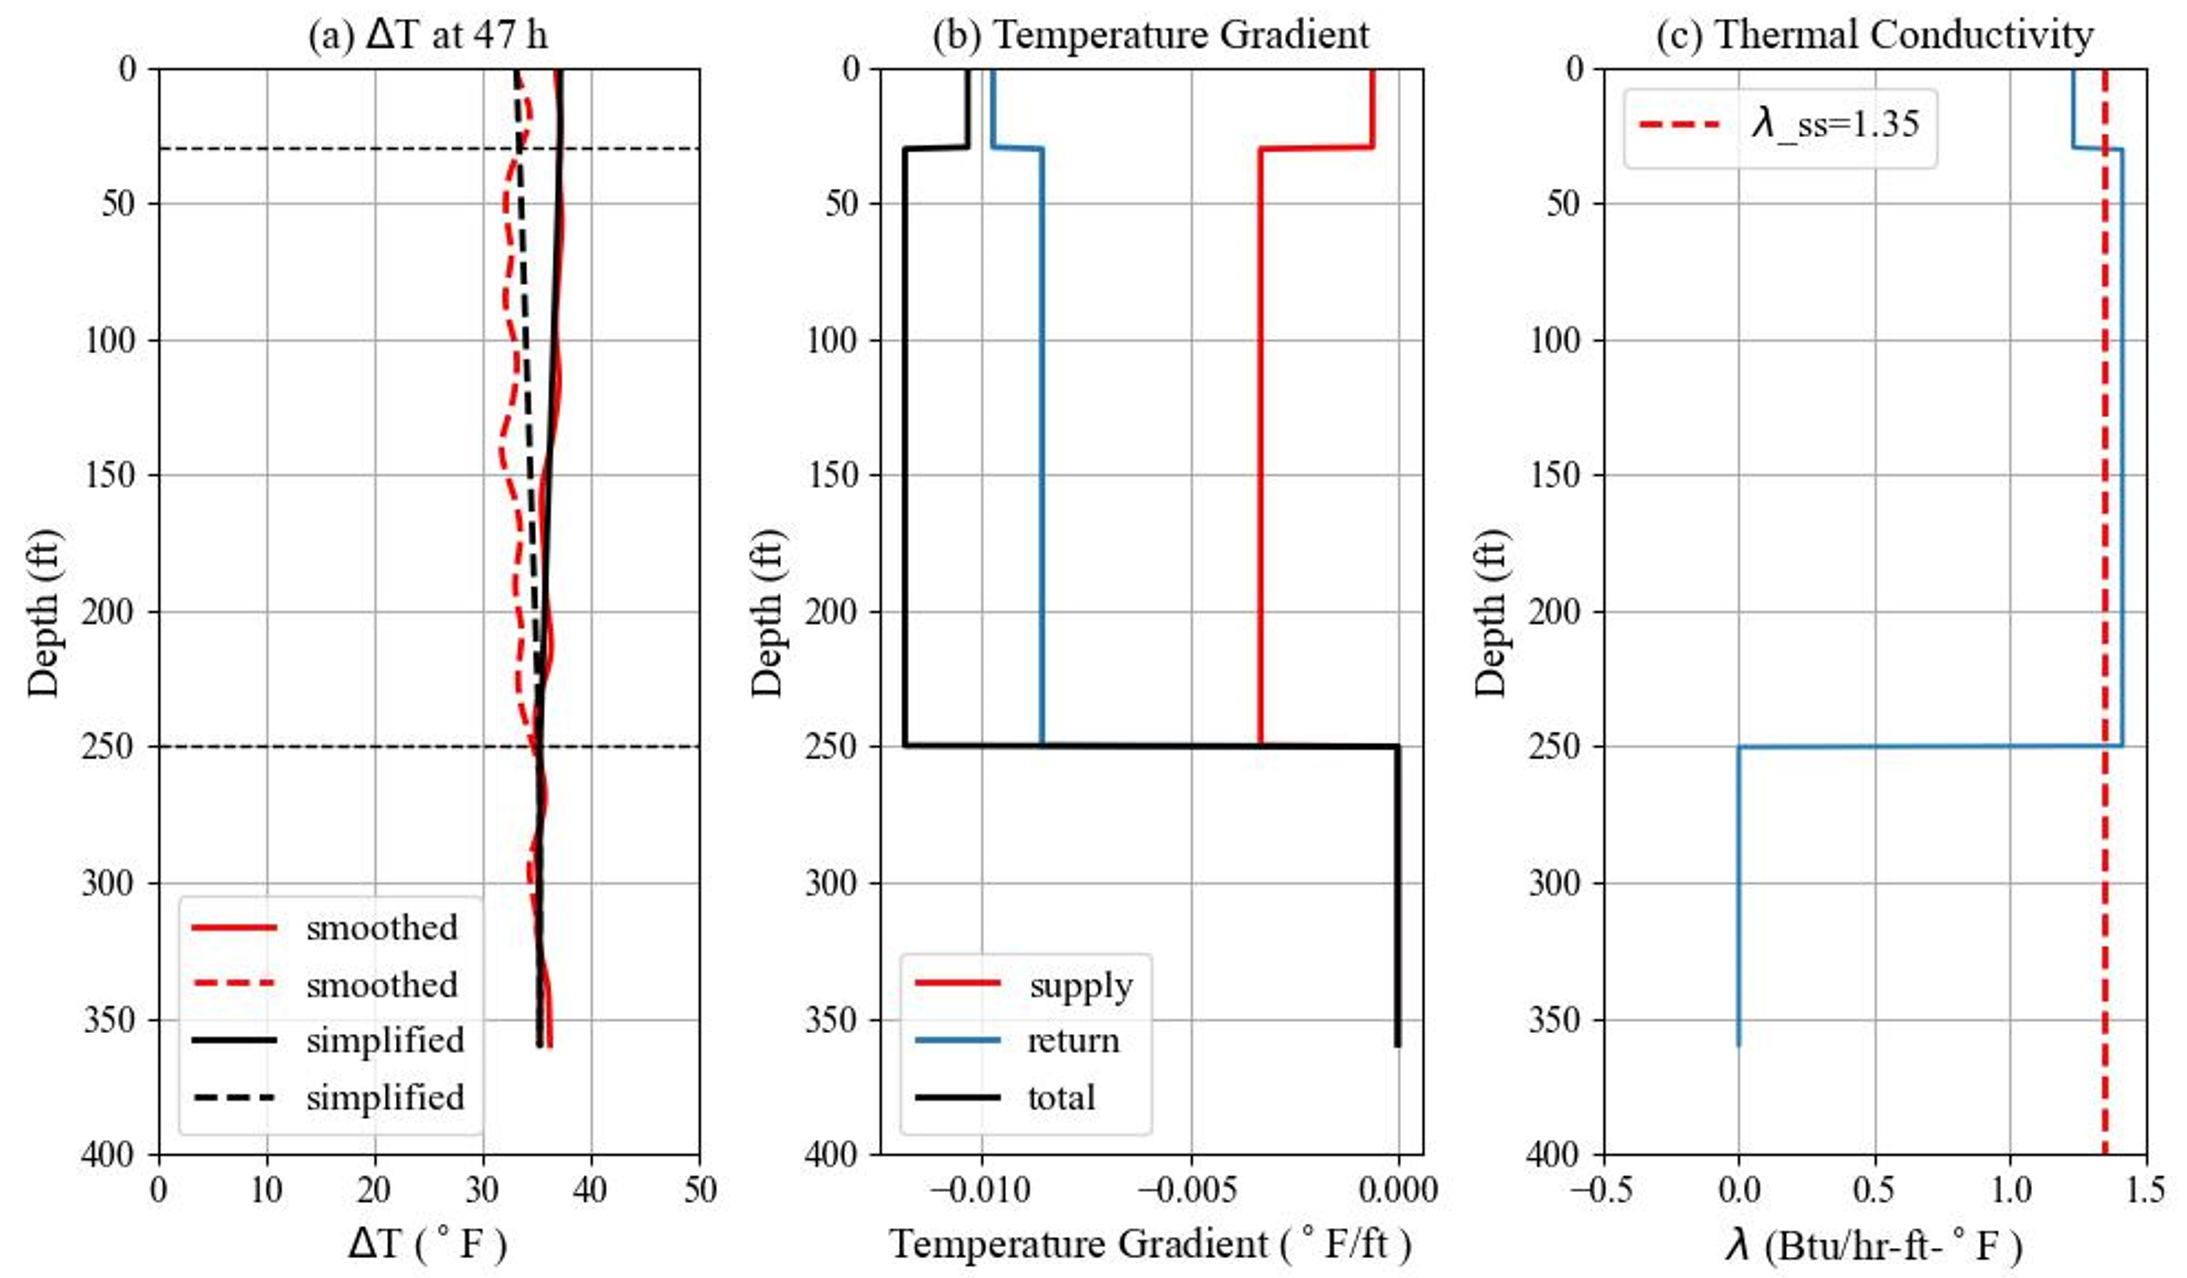
Figure 2 Thermal Conductivity of The Second DTRT Using ALICIA
The heat capacity profile at the test site is estimated based on typical heat capacity values of soils/rocks listed by Kavanaugh & Rafferty (2014) as shown in Table 1. Thermal diffusivity profile is calculated and shown in Figure 3. In the first DTRT, the thermal diffusivity of the sediment above 30 ft is 3.5 – 7.5 ft2/day, and the thermal diffusivity of the bedrock from 30 ft to 250 ft is 0.8 – 1.2 ft2/day; in the second DTRT, the thermal diffusivity of the sediment above 30 ft is 0.7 – 1.4 ft2/day, and the thermal diffusivity of the Franciscan Complex from 30 ft to 250 ft is 0.8 – 1.2 ft2/day.
Table 1 Layered Heat Capacity
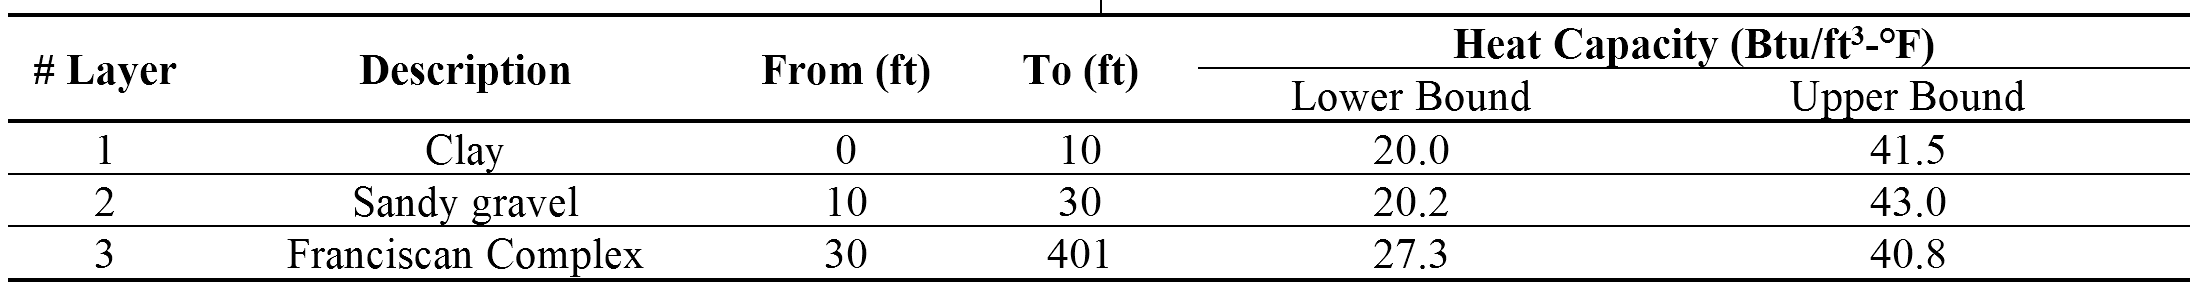
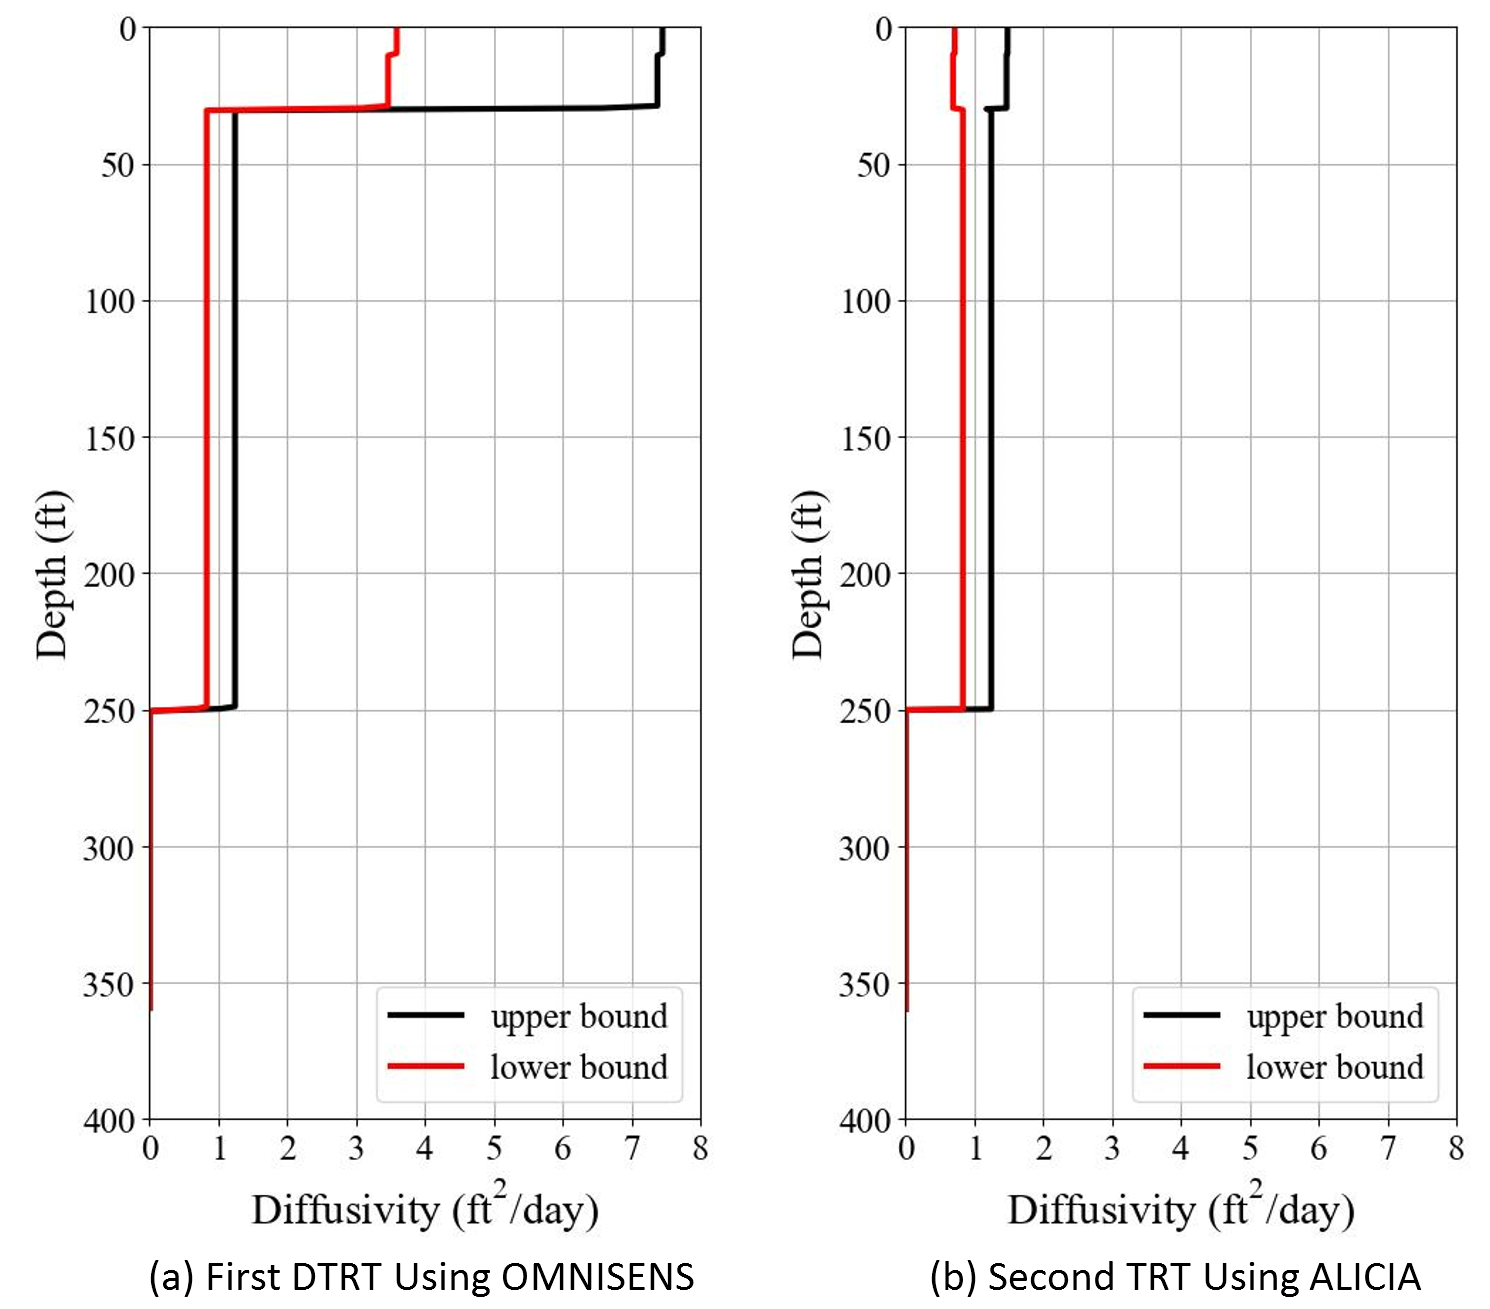
Figure 3 Thermal Diffusivity Profiles

Collaborator: California Department of Transportation (Caltrans)
Researchers: Jiahui Yang, Kecheng Chen, Yaobin Yang Kenichi Soga (UC Berkeley)
Domains: Energy Systems
Capabilities: Distributed Fiber Optic Sensing (DFOS) – Distributed Temperature Sensing (DTS)
Publications:
Berkeley News: https://news.berkeley.edu/2022/03/30/uc-berkeley-drills-400-foot-borehole-to-explore-geothermal-heating-on-campus/
CEE News: https://ce.berkeley.edu/news/2699